
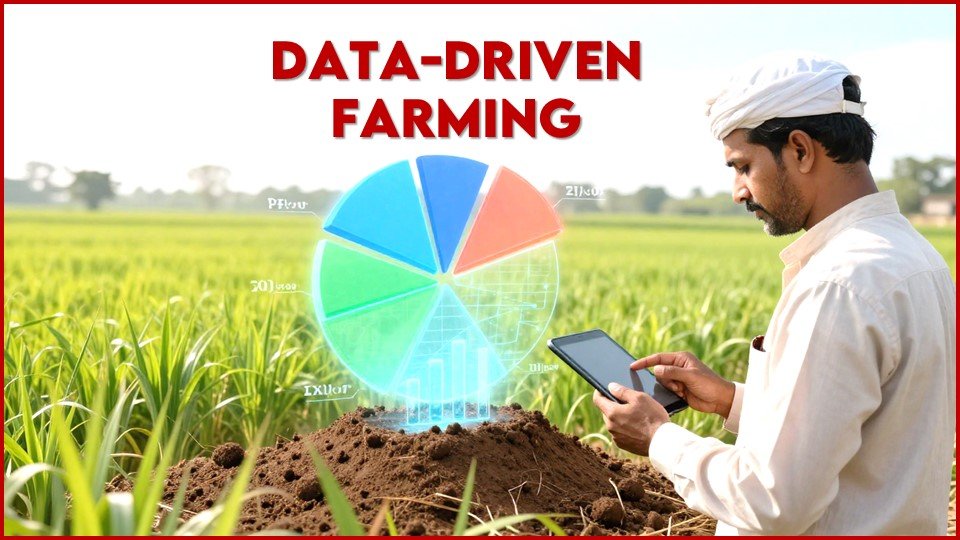
Indian agriculture has always been rooted in observation. Farmers watch the sky for signs of rain, study soil texture with their hands, and rely on generational knowledge to decide what to plant and when. But over the past decade, something new has entered the fields alongside tractors and drip irrigation systems: data.
From crop yield estimates to fertilizer usage, water consumption, pest cycles, and market prices, modern agriculture is producing more information than ever before. The challenge is no longer access to data, but understanding it. For many farmers, agribusiness managers, and policymakers, numbers alone do not tell the full story. What matters is how those numbers are interpreted and turned into action.
This is where visual thinking is quietly transforming agriculture.
Why Numbers Alone Are No Longer Enough
Consider a mid-sized vegetable farmer in Maharashtra tracking input costs over a growing season. They may have records showing expenses for seeds, fertilizers, labor, water, and pest control. On paper, these numbers exist as rows in a notebook or spreadsheet. But when decision time comes — deciding whether to expand acreage or switch crops — raw figures can feel overwhelming.
Visual representations help bridge that gap. Seeing that fertilizer accounts for 35 percent of total costs, labor 25 percent, and irrigation 20 percent instantly clarifies where efficiencies might be found. Instead of guessing, farmers can make informed choices backed by evidence.
This shift is especially important as farming margins tighten and climate variability increases risk.
Understanding Crop Economics Through Simple Visuals
One of the biggest challenges in agriculture is balancing cost and return. Farmers often know which crops are profitable in general, but profitability can vary dramatically by region, season, and farm size.
Visual tools allow producers to break down income sources and expenses in ways that are easy to compare year over year. For example, an orchard owner may track revenue from multiple fruit varieties across a single season. When those revenues are visualized proportionally, it becomes easier to see which crops justify further investment and which may need reevaluation.
Even small-scale farmers benefit from this approach. Visual clarity builds financial confidence, especially for those transitioning from subsistence farming to market-oriented production.
Fertilizer, Water, and Input Optimization
India’s agricultural sector faces growing pressure to reduce overuse of fertilizers and water while maintaining yields. Policymakers often talk about efficiency, but change happens at the field level.
When farmers can clearly see how much of their total input budget is going toward nitrogen fertilizers versus organic amendments or micronutrients, conversations about optimization become more concrete. Visual breakdowns make it easier to experiment responsibly, reducing one input slightly while monitoring effects on yield and soil health.
Some extension workers now use simple visual charts during training sessions to explain nutrient management plans. These visuals help farmers grasp complex relationships faster than tables of figures ever could.
Market Trends and Crop Diversification
Market volatility is another reality farmers must navigate. Prices for grains, vegetables, and fruits fluctuate based on supply, demand, weather events, and global trade conditions. Understanding these trends is critical for long-term sustainability.
Visualizing price distributions across crops can reveal patterns that are easy to miss otherwise. For example, a farmer may notice that while tomatoes offer high peak prices, onions provide more stable returns across seasons. This insight can support diversification strategies that balance risk and reward.
In many cases, farmers and cooperatives use simple digital tools to map income sources visually. When preparing reports or presentations for lenders or partners, tools that allow users to create a pie chart with Adobe Express can help present this information clearly without requiring advanced technical skills.
Cooperative Farming and Shared Decision-Making
Farmer-Producer Organizations (FPOs) and cooperatives are becoming increasingly important in India’s agricultural landscape. These groups bring together dozens or even hundreds of farmers, making collective decisions about procurement, storage, and sales.
In such settings, transparency is essential. Visual data representations help ensure that all members understand how revenues are distributed, how costs are allocated, and where profits are reinvested. When everyone sees the same picture, trust grows.
Instead of lengthy explanations, a simple visual showing revenue shares from grains, pulses, and horticultural crops can anchor productive discussions during meetings.
Training the Next Generation of Farmers
Agricultural education is also evolving. Students in agricultural colleges are now expected to understand farm economics, sustainability metrics, and agri-tech platforms alongside traditional agronomy.
Visual literacy has become part of that education. Students learn not only how to collect data, but how to present it meaningfully. Being able to summarize a season’s performance visually prepares them for careers in agribusiness management, extension services, and agri-entrepreneurship.
For young farmers returning to family farms, these skills translate directly into better planning and communication with suppliers, buyers, and financial institutions.
Policy Planning and Regional Insights
At a larger scale, visual data plays a critical role in agricultural policy. Governments and research institutions analyze crop patterns, subsidy allocations, and resource usage across regions.
When this information is shared with farmers through extension programs or public dashboards, clarity matters. Visual summaries help communities understand why certain crops are promoted or why water restrictions are introduced during dry years.
Clear visuals also reduce misinformation. When farmers see how resources are allocated regionally, policies feel less abstract and more grounded in evidence.
Technology That Respects Simplicity
It is important to note that effective visual tools do not need to be complex. In agriculture, usability matters more than sophistication. Farmers value tools that are intuitive, accessible, and adaptable to real-world conditions.
Whether used by a single farmer reviewing seasonal expenses or by an agribusiness presenting insights to stakeholders, visual tools work best when they stay in the background and let the data speak.
For this reason, lightweight digital platforms that allow users to create a pie chart with Adobe Express or similar tools have found quiet adoption among agricultural professionals who prioritize clarity over complexity.
Building Confidence Through Understanding
Perhaps the most underrated benefit of visual data in agriculture is confidence. When farmers understand their numbers, they feel more in control. Decisions become proactive rather than reactive.
This confidence matters when adopting new practices, experimenting with crops, or negotiating prices. Knowledge presented clearly empowers farmers to advocate for themselves in markets that are often uneven.
Over time, this shift contributes to a more resilient agricultural ecosystem.
Conclusion: Seeing the Bigger Picture
Indian agriculture stands at a crossroads, balancing tradition with innovation. While technology continues to reshape how food is grown, processed, and sold, the human element remains central.
Visual thinking offers a bridge between data and decision-making. By transforming numbers into insight, farmers gain clarity, policymakers build trust, and communities make smarter choices together. As agriculture becomes more data-driven, the ability to see the bigger picture will be just as important as knowing when to sow and when to harvest. And sometimes, that clarity begins with something as simple as seeing the story behind the numbers.
Latest Post
- Data-Driven Farming: How Visual Insights Are Shaping the Future of Indian Agriculture

- January Issue 2026- Times of Agriculture Magazine
- Top 10 Agricultural Drone Companies in India
- December Issue 2025- Times of Agriculture Magazine
- November Issue 2025- Times of Agriculture Magazine
- Punjab & Sind Bank Introduces Special Program to Support Food and Agro-Processing Sector
- Beyond Classrooms and Gardens: How a Professor Turned His Passion into Purpose
- October Issue 2025- Times of Agriculture Magazine
- Top 10 Pesticide Companies in the World
- September Issue 2025- Times of Agriculture Magazine
- Top 15 Fertilizer Companies in the World
- Top 10 Vegetable Farming Profit Per Acre in India